-
- Quick Search
-
Advanced Search
-
Expression of Genes
-
Expression of Transcripts
(Rank1 to Rank5) -
Download
-
Contact: Wen-chang Lin
Email: wenlin@ibms.sinica.edu.tw
The completion of human genome sequences and the advancements in next-generation sequencing technologies have promoted a clear understanding of human protein-coding genes. However, it is essential to continue the investigation of the complex alternatively spliced mRNA isoforms of protein-coding genes because of vastly expanded RNAseq data. Furthermore, errors can be concealed within numerous types of bioinformatics and genomic databases, a problem which is worsened by heavy cross-data utilization and delayed data update cycles. In this report, we contribute our recent efforts in alternative bioinformatic investigations on expression-based reference transcripts and human protein-coding genes. Therefore, we have aimed to provide another flexible resource for the investigation of human protein-coding gene transcripts that is principally based on normal tissue expression profiles. Users should be able to observe expression profiles and investigate alternatively spliced transcript isoforms. Therefore, we employed the GTEx dataset to generate such a resource. The current GTEx data release (V8) contains 54 tissue types from 948 individual donors. This dataset provides a unique resource based on analysis of global RNA expression within individual tissues. In this study, we employed the GTEx data for tissue-specific expression analysis on human transcript isoforms. This dataset is a helpful gene expression dataset because it contains different tissue types from numerous human subjects. We analyzed the top-ranked transcript isoform expression profiles in various tissue types and observed that top-ranked transcript isoforms were dominantly expressed transcripts. Diverse tissue expression patterns and modulations among top-ranked transcript isoforms demand a comprehensive investigation for respective protein-coding genes. With concise transcript information of protein-coding genes and easy to use graphical interfaces, this web tool help to examine the top-ranked expressed transcript isoforms in various human tissue types, from which users can identify distinctive functional transcript isoforms for protein-coding genes of interest.

Search human protein-coding gene by :
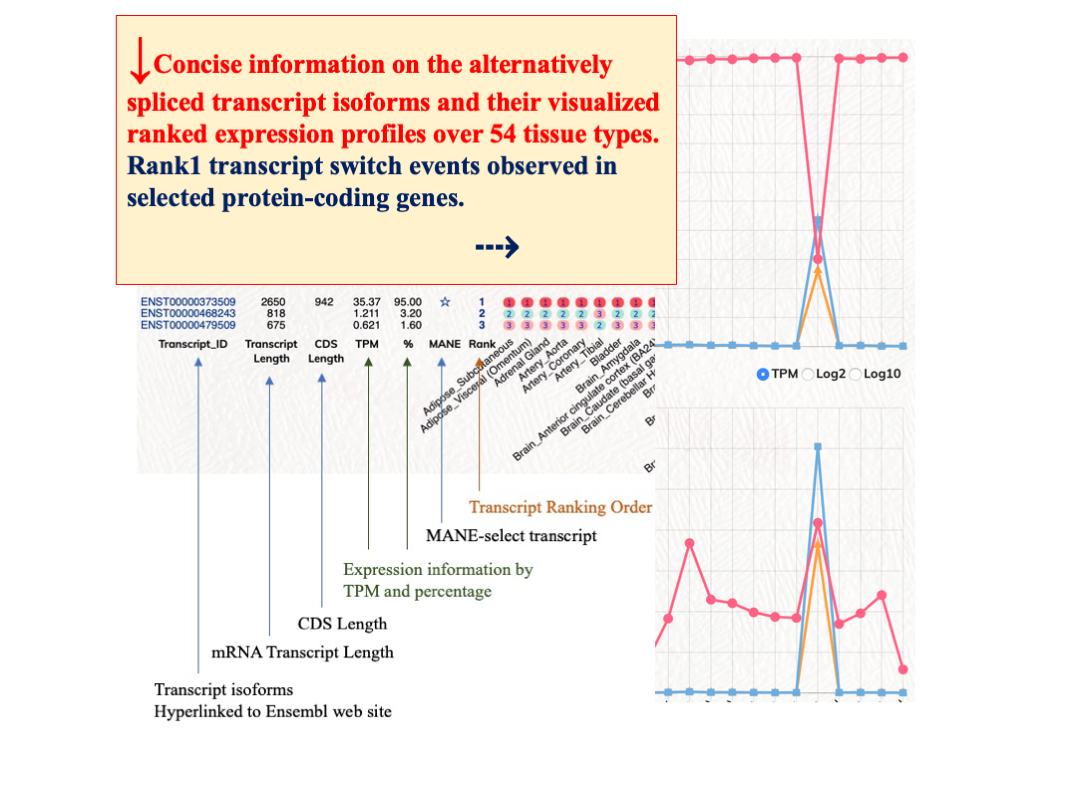
Rank1 transcript switch events among different tissue types
We observed tissue specific modulations among different ranked transcripts. In selected tissue types, the rank1 transcripts of certain protein-coding genes would have reduced expression levels or other ranked transcripts expression would have elevated expression to overtake the rank1 transcripts. These rank1 switch events could implicate significant biological modulations in those protein-coding genes. We have generated a putative gene list of rank1 switch events for users to interrogate these rank1 switch events. Users can first select the rank1 tissue count. ’53’ indicates there is one rank1 switch event among 54 tissue types; ’52’ indicates there are two rank1 switch events among 54 tissue types. Rank1 transcript % cutoff option can be used to further filter the expression coverage of the rank1 transcript.
Distribution and expression of human genes according to transcript isoforms per gene. [1 to 20 isoforms are displayed]
We analyzed the expressed transcript isoforms for protein-coding and non-coding genes and tabulated the numbers of genes according to the transcript isoforms per gene. The most abundant class is the single transcript genes in respective groups, which has 2,756 genes for protein-coding genes. For non-coding genes, the single transcript protein-coding genes have 31,712 genes. Click on the pie chart, it will display the 1~20 classes of gene distribution on the protein-coding genes or non-coding genes. Click on the column graph, it will display the numbers and percentages of protein-coding genes or non-coding genes in that particular transcript isoform per gene class.
Gene expressions of transcripts per gene
Expression percentages of top-ranked transcript isoforms in human protein-coding genes. We calculated the expression distribution percentage of transcript isoforms in human protein-coding genes. Rank1 transcript isoform is the dominant expressed transcript isoform. Rank1 to Rank5 are the dominant classes to transcript isoforms in protein-coding gene expression.
We have provided the Rank1 to Rank10 transcript isoform information files for human protein-coding genes. The download files have the following data fields, which were retrieved from the GTEx files : Gene_id, Gene_name, Tx_count, Transcript_id, Rank_TPM (transcript), Gene_expression_TPM, Percentage (transcript/gene), Transcript_length, CDS_length, Biotype, Transcript_name.
Rank1 top-ranked transcript data : Download
Rank2 top-ranked transcript data : Download
Rank3 top-ranked transcript data : Download
Rank4 top-ranked transcript data : Download
Rank5 top-ranked transcript data : Download
Rank6 top-ranked transcript data : Download
Rank7 top-ranked transcript data : Download
Rank8 top-ranked transcript data : Download
Rank9 top-ranked transcript data : Download
Rank10 top-ranked transcript data : Download


